Count of rendered templates in the Web Debug Toolbar
The Web Debug Toolbar provides informations about Templates.
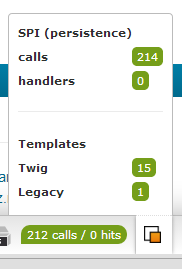
The available informations are the number of rendered templates, and the list of files, ordered with rendering duration.
When the Web Debug Toolbar is popped, you can read the number of templates used, dispatched between :
Count of rendered templates in the Web Debug Toolbar
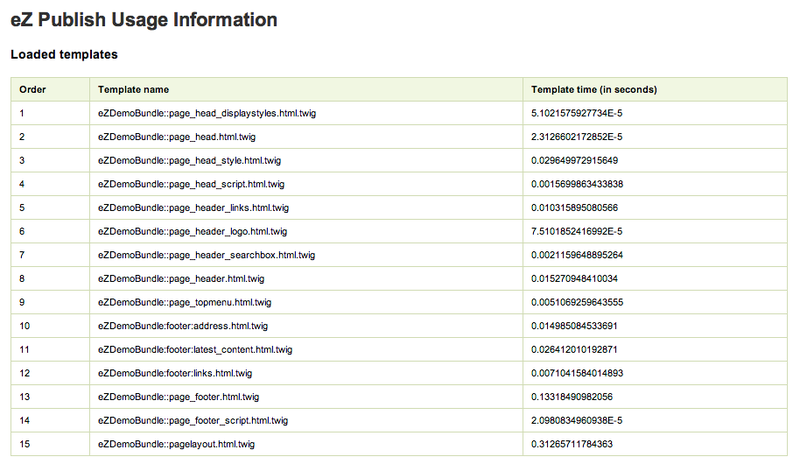
Then you can get the detail for both category of templates.
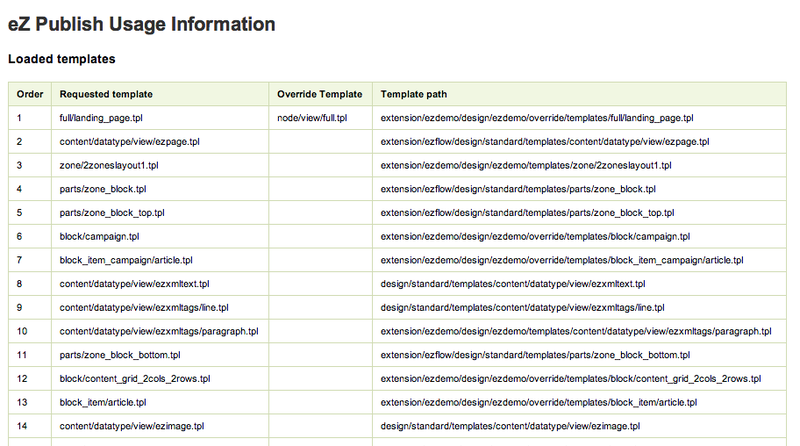
The profiler, for Exponential twig templates, displays a list of loaded templates. The columns of the table are :
The profiler, for legacy templates, displays a list of loaded templates. The columns are :