eZ odoscope Keyfigure Study 1
The bounce rate represents the percentage of visitors who entered the website and "bounced" (left) rather than continue viewing other pages of the website. It is given by the filter "Session Length = 1".
Let's see a Case Study for the bounce rate.
We have set the following:
With this configuration we will be able to analyze the bounce rate for European users on the website.
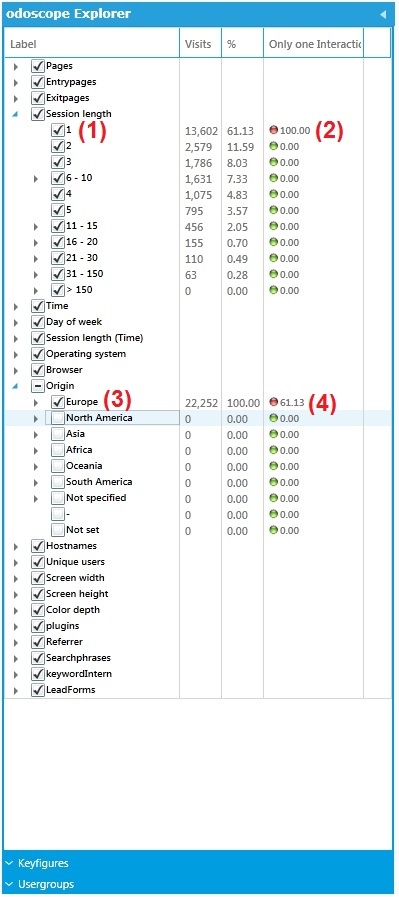
After we put the above settings on place, we will have the following information on odoscope Explorer:
eZ odoscope Keyfigure Study 1
Remember what Active and Inactive sets mean:
Now take a look at the following scenario:
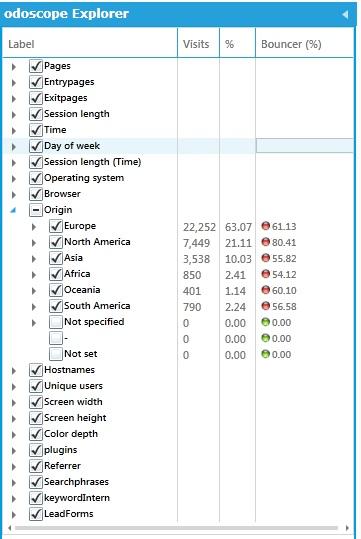
eZ odoscope Bounce Rate
We have added some more filters to our Filtergroup (Origin), and the correlation between the Keyfigure and the "Europe" filter has not changed, which means: from the total amount of visits from Europe, 61.13% bounced. As you can see, only the percentage of visits has changed, as we added more visits to the overall amount of visitors (by selecting other filters: North America, Asia, Africa, Oceania and South America).
Now, if we change the keyfigure to "Inactive", we will see the following results:
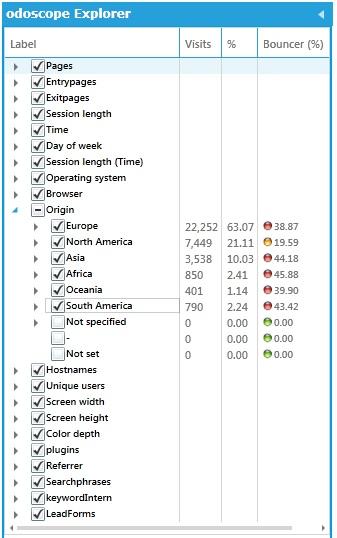
eZ odoscope Bounce Rate Inactive
These are the results for the Inactive setting, which gives you the percentages for the 'rest of the filters' - visitors that did not bounce.
The lead traffic rate represents the percentage of users visiting certain goals or lead pages. It is given by any filter available on the filtergroup LeadForms.
Let's see a Case Study for the lead traffic rate:
We want to know how many visitors from all segments ("All Users"), detailed by origin, did not click on any form available in our website in the last 90 days. We need to assess the effectiveness of a campaign we launched three months ago, to improve website usage.
We have set the following:
After setting this configuration up, we have the following results:
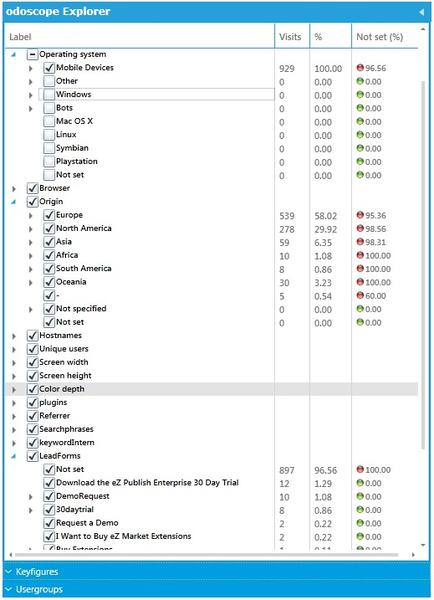
eZ odoscope Keyfigure Study 2
Data Analysis:
If you sum all percentages, you will get 100%.
Hints: To see the percentage of users who clicked on a form, set the Keyfigure to Inactive. To see the accesses to other forms, change the keyfigure filter to any of the forms available on the filtergroup LeadForms. To see data for a specific segment, select or create a new Usergroup.
The internal search rate represents the percentage of visitors searching on the internal search bar of your website. It is given by any filter available on the filtergroup KeywordIntern.
Let's see a Case Study for the internal search rate regarding Exponential website.
We want to know the percentage of visitors that are using the internal search bar of the website:
eZ odoscope Keyfigure Study 3
We have set the following:
After setting this configuration up, we have the following results:
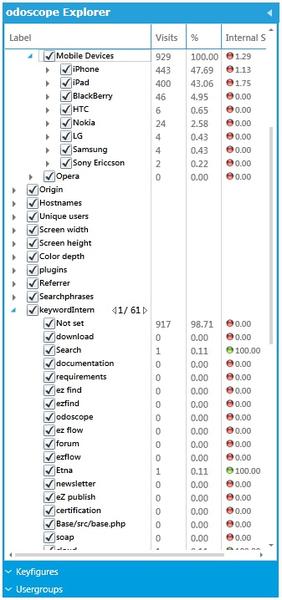
eZ odoscope Keyfigure Study 3
Data Analysis:
Hint: As you can see, the "KeywordIntern" has several filters, distributed through several pages (61 pages). Use the little arrows shown at the right side of the filtergroup name to navigate between the pages and see more results.
Hints: To see the percentage of users who used the internal search, set the Keyfigure to Inactive. To see the searches for other words, change the keyfigure filter to any of the words available on the filtergroup KeywordIntern. To see data for a specific segment, select or create a new Usergroup.
You can create an infinite number of combinations with filters, usergroups and keyfigures to analyze data from different time periods, according to what you have in mind and to your business needs.
Powered by Exponential™ CMS Open Source Web Content Management. Copyright © 1999-2013 eZ Systems AS (except where otherwise noted). All rights reserved.